
Volatility Bands Recap > Gaussian Gains: 72% of sessions stayed inside the rails. 28% pushed outside.
Monthly Recap


Volatility Bands: 4-Month Review (May–August 2025)
The Stats at a Glance
Across 84 trading sessions:
Outside Closes: 23 (27.4%)
Inside Closes: 61 (72.6%)
That’s almost exactly what you’d expect from a bell curve distribution: ~68% of outcomes fall inside ±1 standard deviation (1σ), ~32% fall outside.
The Vol Bands have mapped market behavior with statistical precision, and actually contained a bit better than what a typical bell curve suggest.
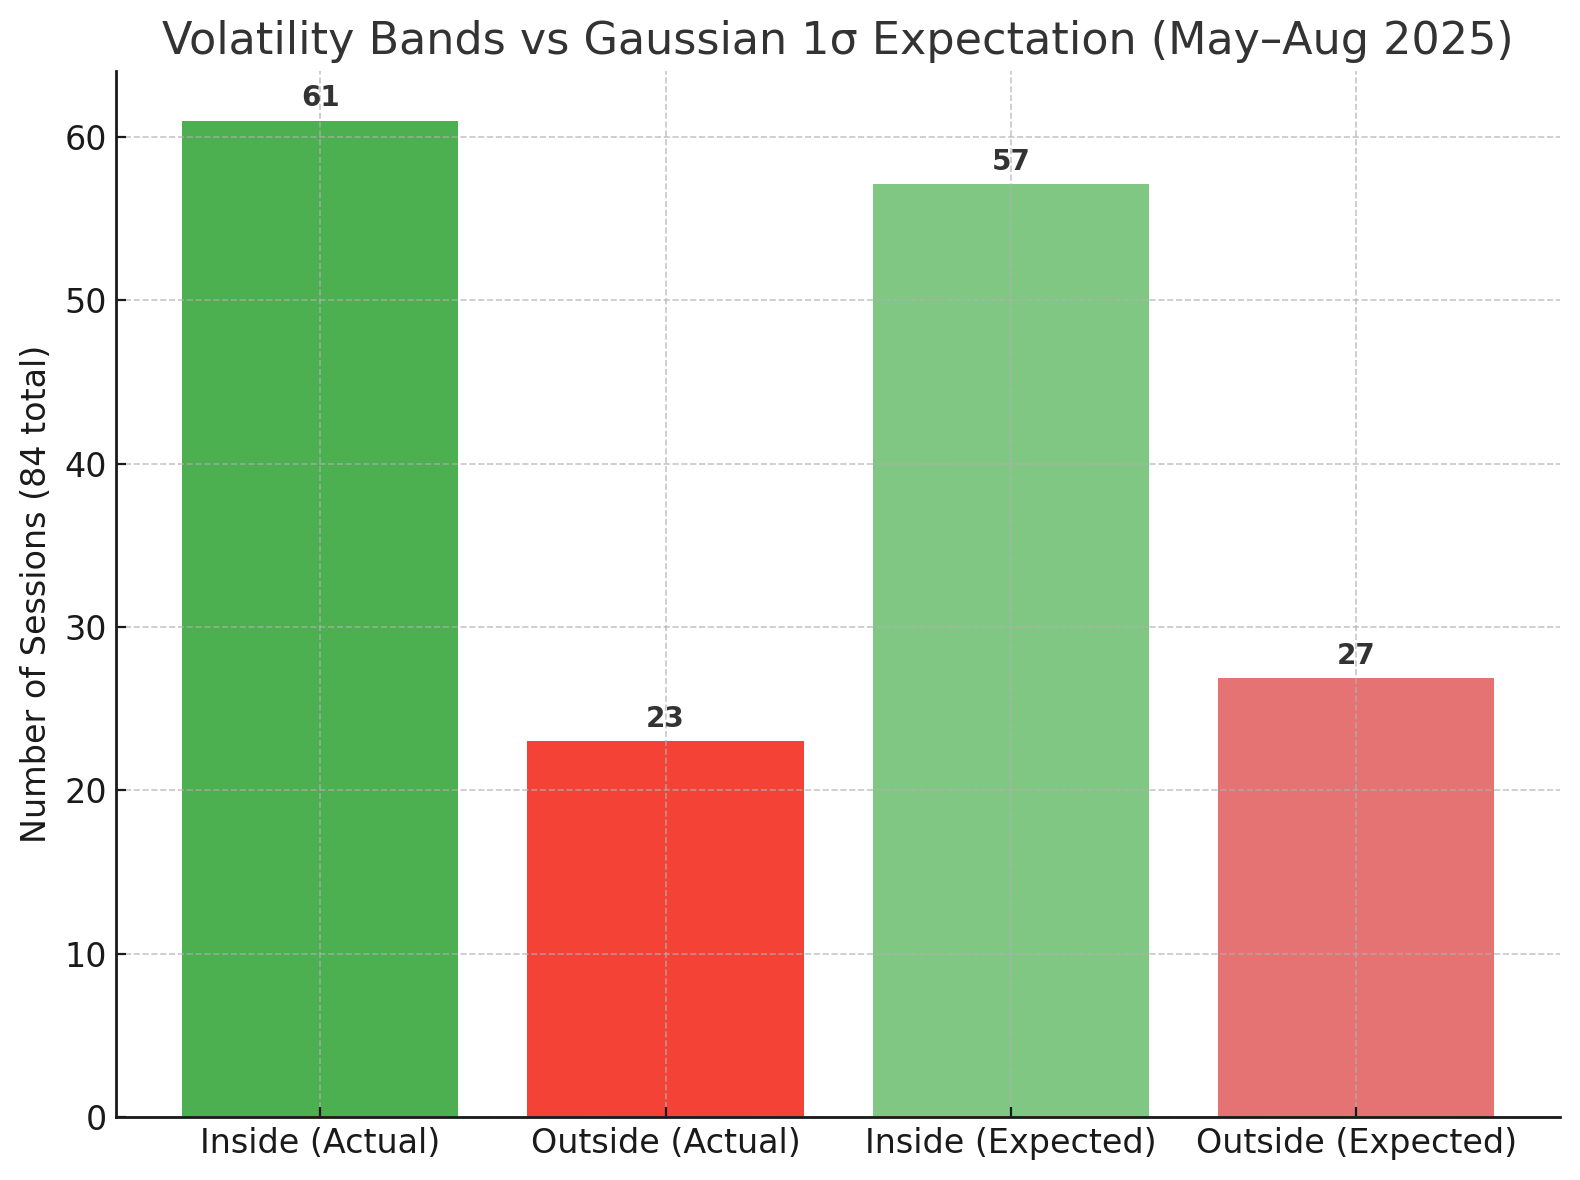
Here’s the bell curve distribution visual:
Green (Actual Inside = 61 sessions) vs Expected Inside = 57
Red (Actual Outside = 23 sessions) vs Expected Outside = 27
The takeaway: Over 4 months, the Vol Bands have tracked market behavior almost exactly in line with 1σ probability theory — 73% inside vs the expected 68%, so even a touch better in regards to containment.
Distribution Check (Bell Curve in Action)
Statistically, if Vol Bands reflect ±1σ moves, ~27 out of 84 sessions “should” have closed outside.
Actual = 23.
That’s a 96% alignment with Gaussian expectation.
Markets aren’t perfectly Gaussian — tails are fatter — but over this 4-month sample, the math has been remarkably consistent.
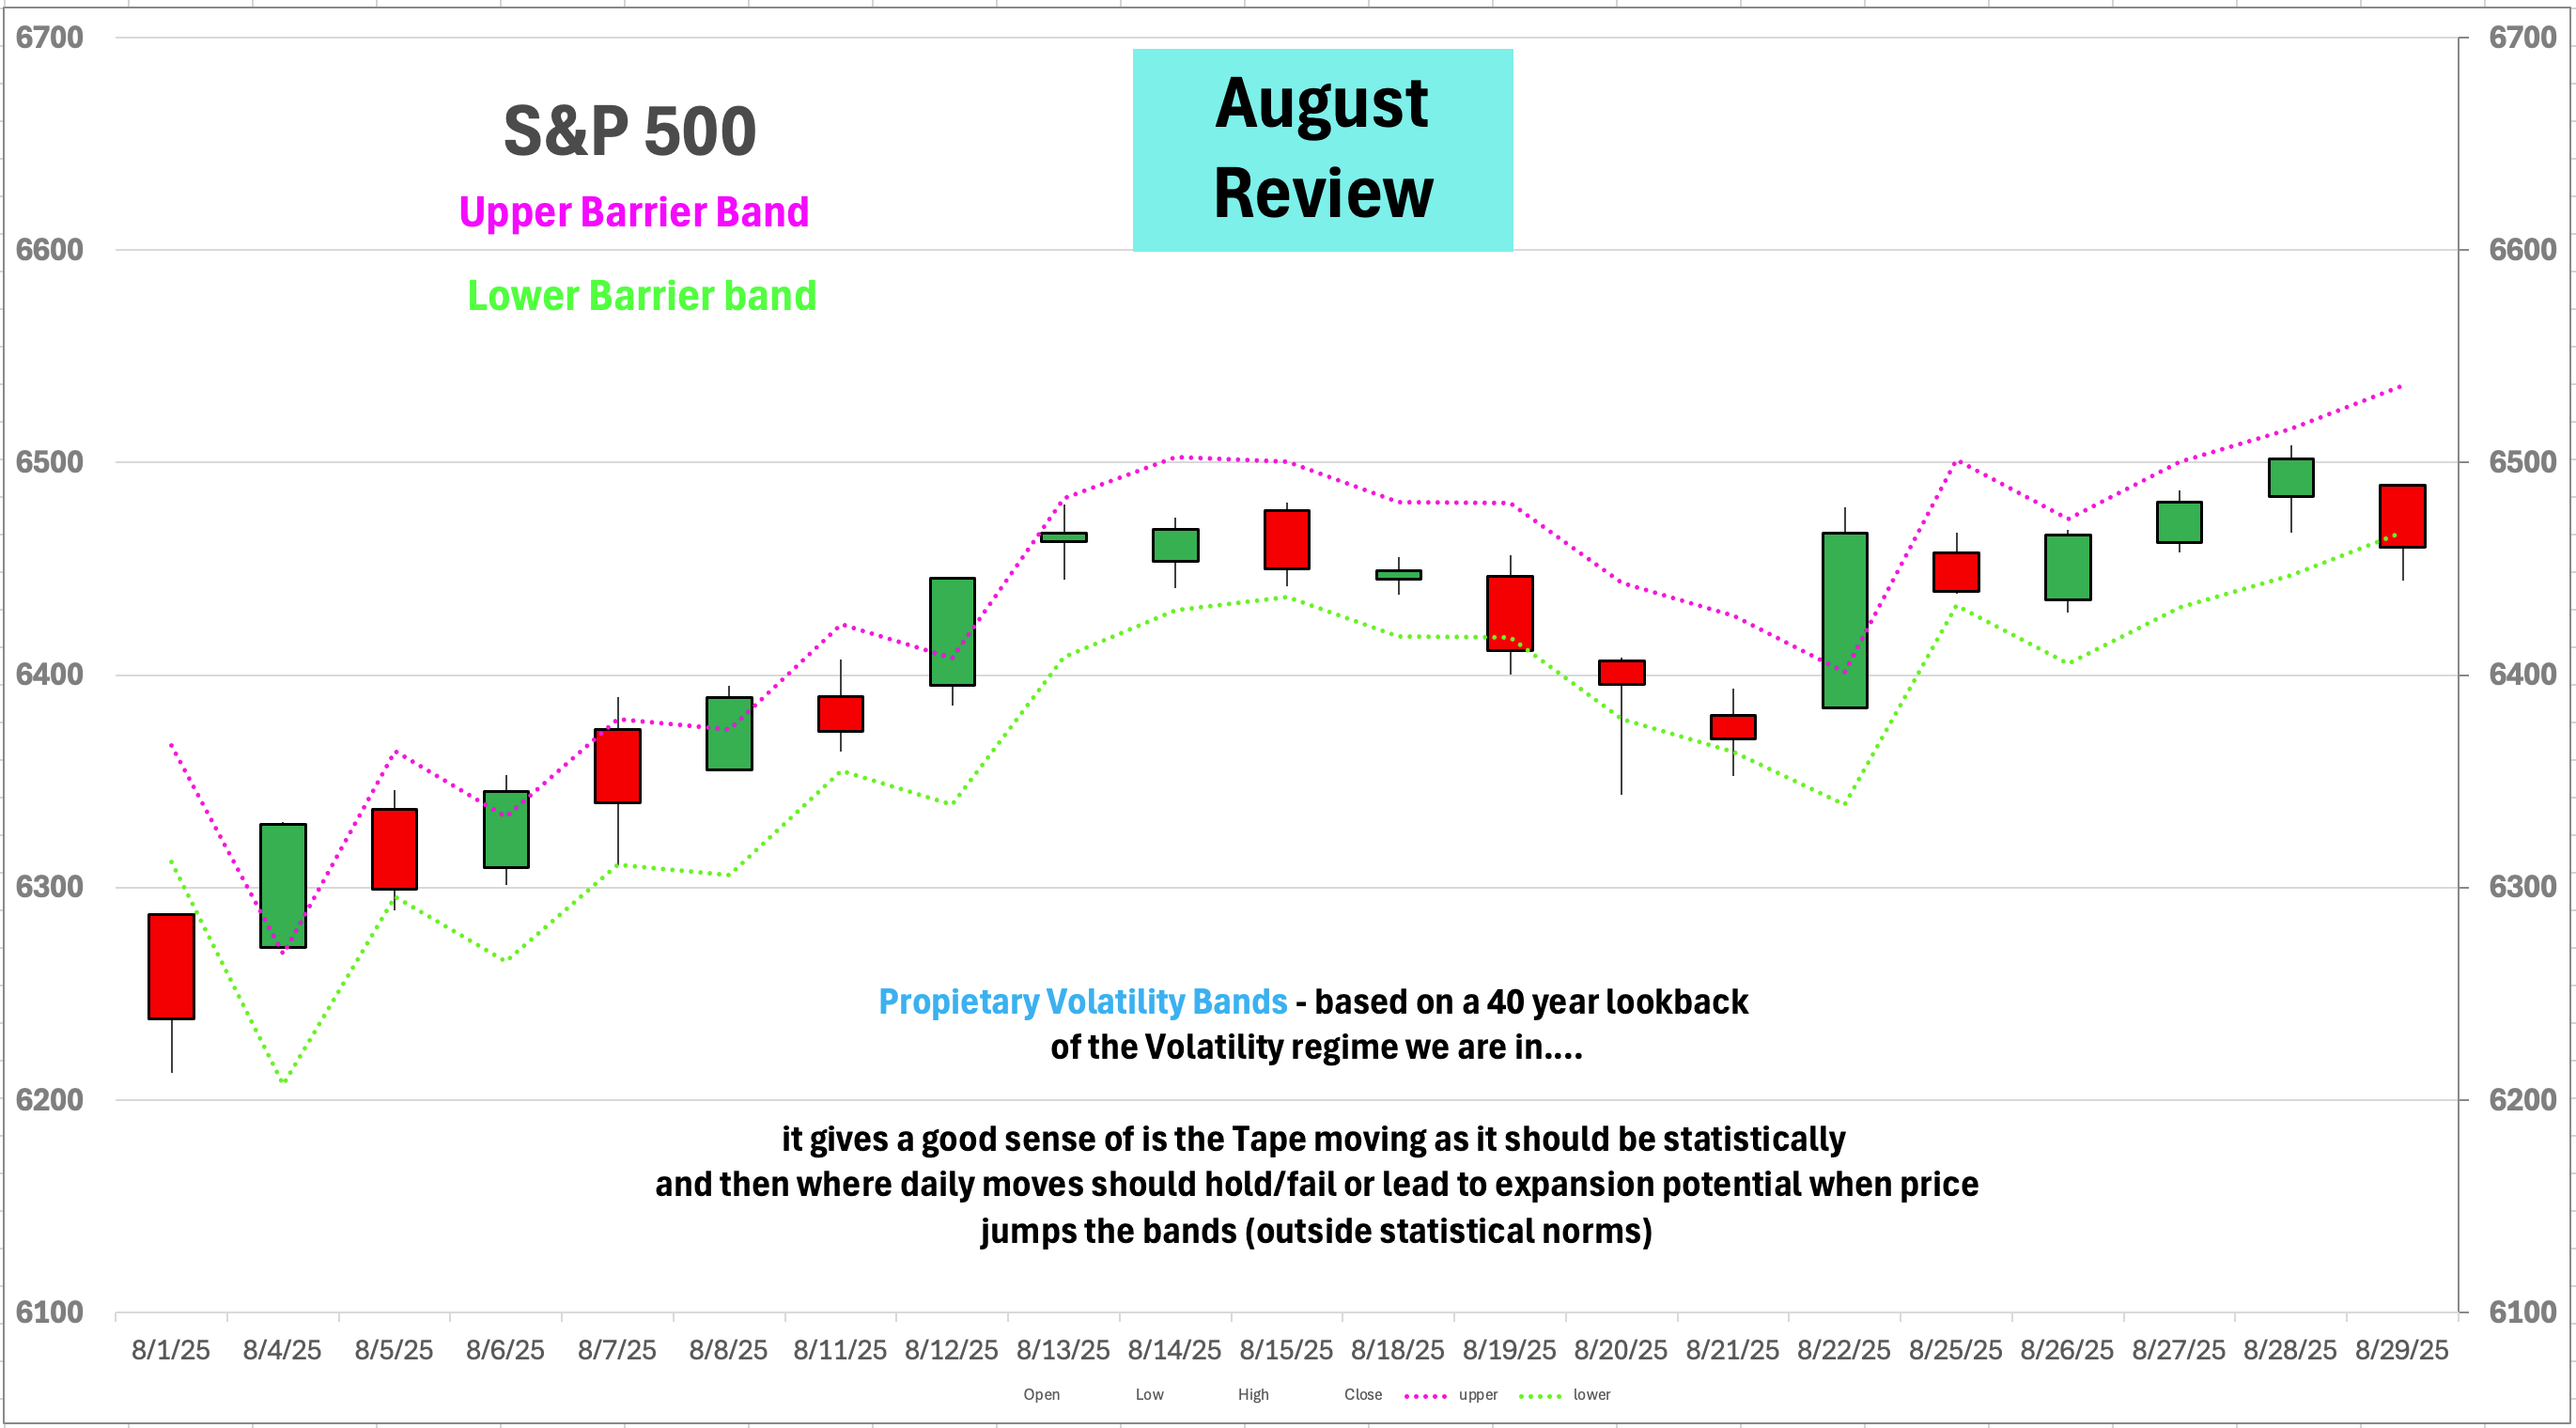
August review:
Interestingly the Average Daily move for the 21 sessions in August was

When you go back 40+ years based on the Volatility regime we where in for August the Daily expected move was supposed to be:
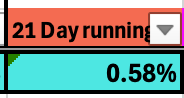
I’ll call that better than Government work. Basically exactly as expected
The actual bigger difference has been Intra-day Volatility and ranges. Based on that same history we should have been getting:
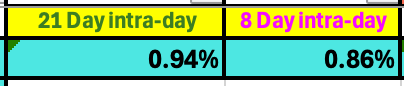
And instead for All of August intra-day range averaged a much more muted:

So the daily Average moves has been spot on but intra-day volatility has actually been rather benign compared to the Vol regime we are in, maybe this changes in September?
Monthly Breakdown
May: 3 outside closes (14.3%) → well well below 1σ expectation, bands contained the chop.
June: 7 outside closes (35%) → right on top of the 1σ expectation, as volatility expanded.
July: 5 outside closes (22.7%) → well contained again like may but more balanced.
August: 8 outside closes (38.1%) → above expectation, a true expansion month with catalysts (Powell, macro shifts).
Here’s the visual:
Green bars = % of sessions that closed inside the Bands
Red bars = % of sessions that closed outside
Dashed lines = Gaussian 1σ expectation (68% inside, 32% outside)
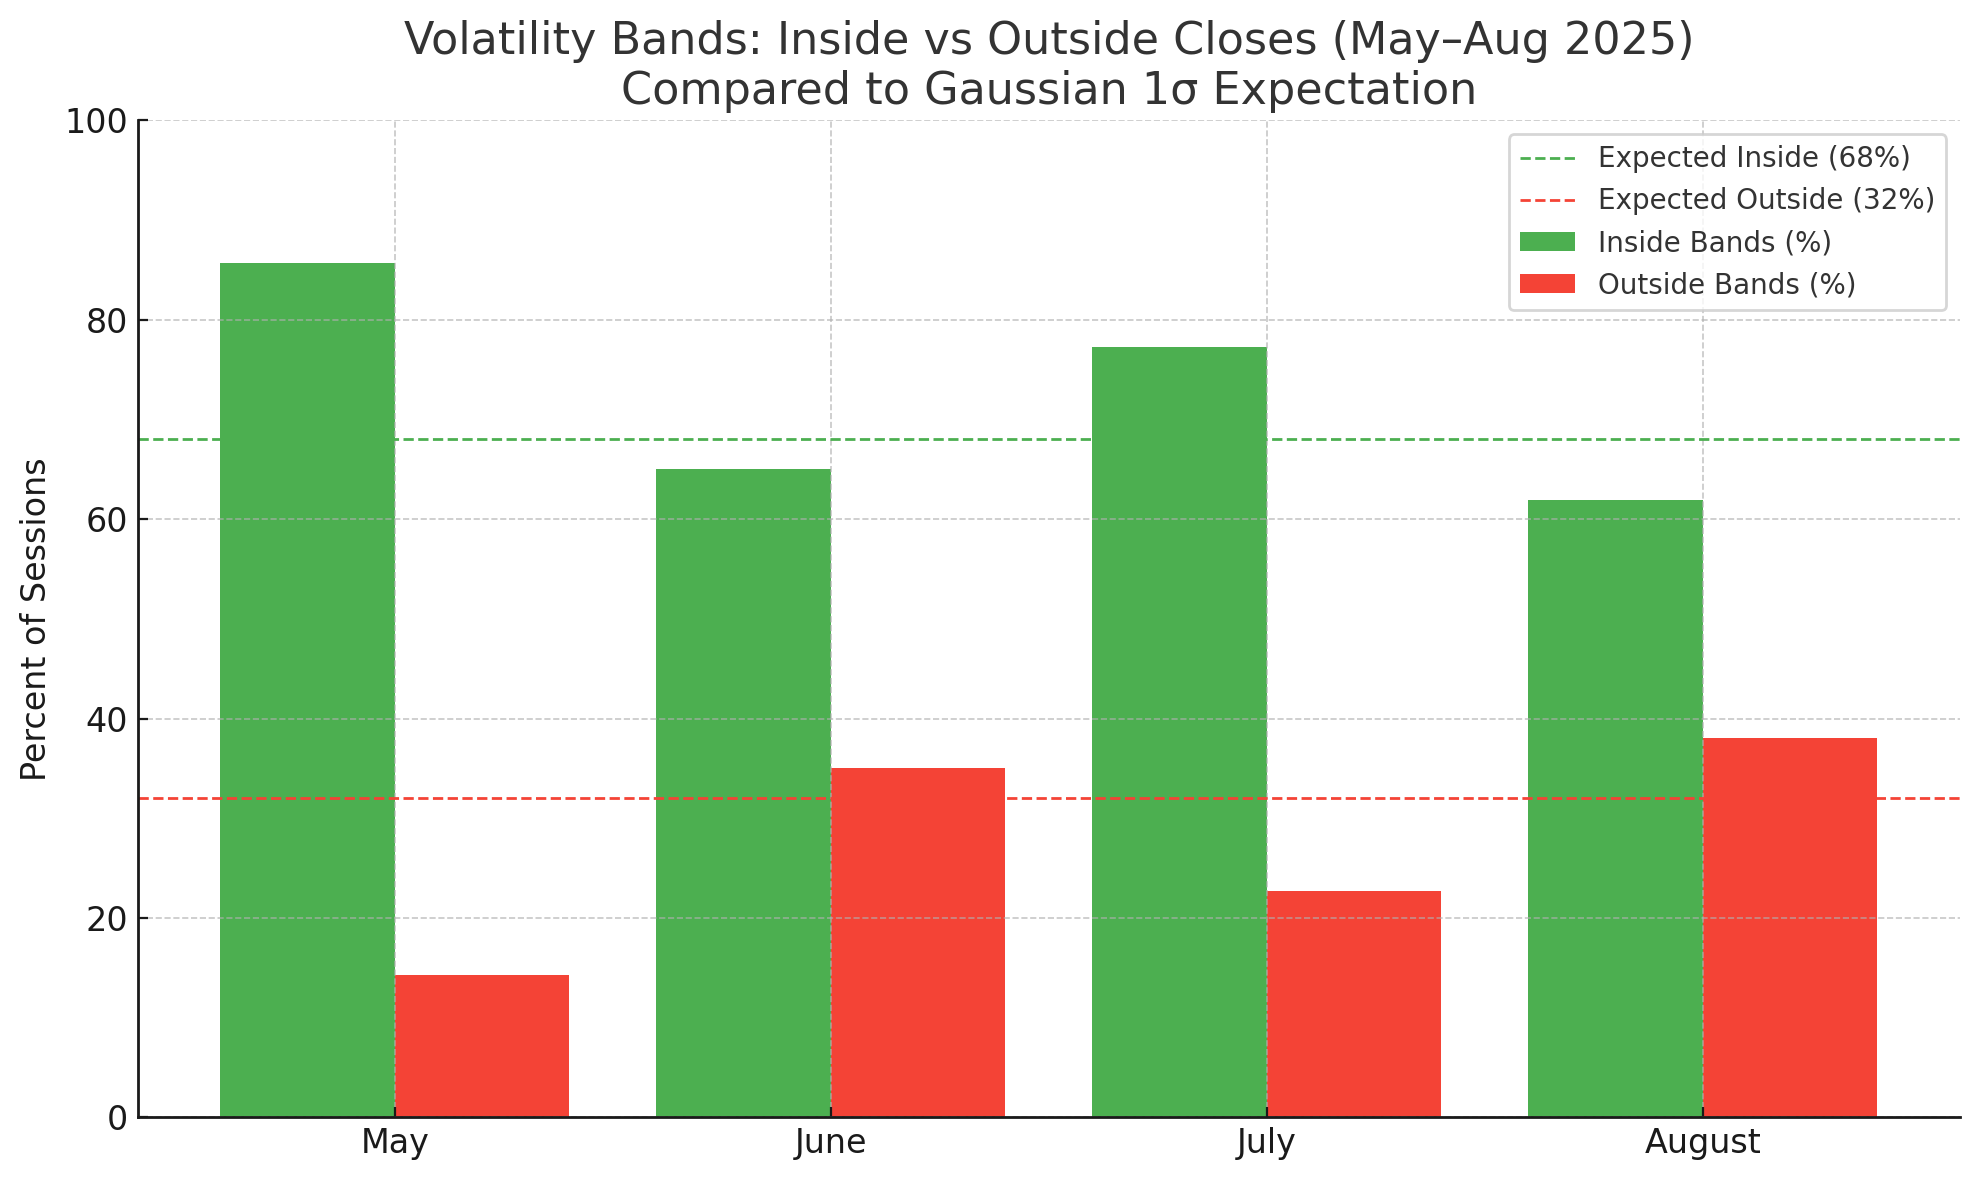
You can see:
May was over-contained (86% inside).
June and August were expansion months (outside closes ~35–38%).
July over contained much like May, but closer to the 1σ expectation.
Across all 84 days, the average aligned a little better than what the bell curve would expect.
Context Matters
The outliers weren’t random: And why I give you the daily write-ups on “catalyst type days” and intra-day commentary to look out for trending tape vs using Vol bands at face value.
Event-driven spikes (Powell 8/22, CPI days, gap-downs like 8/1).
Trend signals (May 12, June 5, Aug 4).
False breakouts/downs reverted back inside the bands (12+ sessions, in July and August).
Takeaway
72% containment → Bands working exactly as designed.
certain Outliers tied to catalysts → probability ≠ randomness.
The edge: Knowing when you’re trading inside the bell curve (fade/revert) vs. when you’re dealing with a legitimate tail event (trend, breakout).
Bottom Line
The Volatility Bands aren’t just lines — they’re a probability distribution laid over price.
And the last 4 months prove it:
When traders chased moves blindly, they got chopped.
When you respected the math, the probabilities kept you aligned with the tape.
Help take emotion out of making bad decisions and properly align yourself with Probabilities
That’s Volatility Therapy.
Probability-driven guidance. Every single day.
Not a Subscriber Yet?
Here’s what you’re missing:
Take the Guesswork Out of Daily Market Swings
With our proprietary Volatility Bands, you know the expected range — daily and intra-day — before the open.
🛑 No more getting caught offsides
❌ No more chasing fake breakouts or breakdowns
✅ Just clean probabilities and smart risk framing
Legal Disclaimer
The content published on this Substack is for **informational and educational purposes only** and should not be construed as financial, investment, legal, or tax advice. The information does **not** constitute an offer, solicitation, or recommendation to buy or sell any securities, investment products, or strategies. All views expressed are those of the author and are subject to change without notice.
No investment decision should be made based solely on the information presented. This content is not a substitute for personalized advice from a qualified financial advisor, accountant, or attorney. **You are solely responsible for your own investment decisions** and should conduct your own due diligence.
**Past performance is not indicative of future results.** The value of investments may fluctuate, and you could lose part or all of your capital. No guarantees are made that any opinions, forecasts, or strategies will be profitable or accurate.
This material is intended for **private, personal use only** and may not be reproduced or redistributed for commercial purposes without prior written consent of the author.
The author may hold positions in securities mentioned and may transact in them without notice. Access to paid content does **not** create a client relationship or imply investment advisory services.
“Volatility Therapy” is **not a registered investment advisor** and does not provide individualized investment advice. References to “the author” refer to the individual or entity operating under the *Volatility Therapy* publication.
This content is intended for **U.S. residents** and may not comply with the laws or regulations of other jurisdictions.
Respect the bands, 👍🏼
Would recommend running this across different VIX ranges. My guy says that the Vol bands are going to be more accurate at certain VIX ranges. Selling Iron Condor could be highly profitable.